

Oil and natural gas downtrend broken: use volatility to your advantage

The sharp sell-off in oil and natural gas appears to have been cut short. But against an uncertain global macro backdrop, the path for energy commodities near term may be less directional and more volatile.
The effective use of leveraged and short ETPs tracking oil and natural gas under such conditions is through switching positions over shorter holding periods regularly.
The cold weather in the US and more upbeat assessments of future global demand conditions for energy have cut short the downtrend in natural gas and crude oil. This after natural gas and crude oil have fallen by 40% and 54%, respectively, since July 2014 to the end of Jan 2015 (see chart 1). Nevertheless, the supply glut stemming from US shale production and weakening industrial activity from China underpin the downbeat sentiment in energy commodities. As investors assess the discounted levels of energy prices against an uncertain global macro backdrop, the path of natural gas and oil prices ahead is likely to be less directional and more volatile.
With natural gas and crude oil reverting back to price patterns investors are used to seeing, it is important to stress their relative high volatility and the main driving forces behind it. For investors seeking a leveraged exposure to energy commodities, a change in strategy back towards switching positions more frequently may be the best way to play natural gas and crude oil in this market environment.

Natural gas and oil are amongst the most volatile assets in commodities
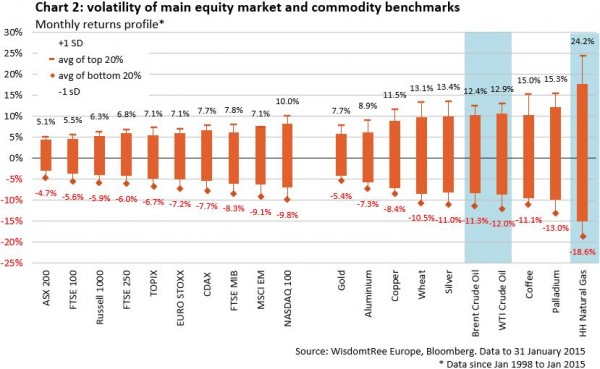
Chart 2 summarizes the monthly returns distribution since 1998 for major benchmarks within equities and commodities, the two asset classes known for their high volatility. It shows the +1 and -1 standard deviation of returns from the mean, as well as the average of top 20% and bottom 20% returns. As is evident, many commodities, in particular within energy and agriculture, produce price fluctuations that are much larger than most of the major equity benchmarks, including that of the tech concentrated NASDAQ 100 index.
Within commodities, natural gas futures stand out as being the most volatile. For instance, a +1 standard deviation movement from the mean has typically meant monthly returns for natural gas to have been 7% higher than crude oil, while a -1 standard deviation movement from the mean has meant monthly returns for natural gas to have been 6% lower than crude oil. In extreme episodes, such as during the 2008 credit crisis, or in the cold winters in the US in recent years, monthly returns (mostly falling outside calendar months) have been much higher. For natural gas, the average of the top (bottom) 20% of ranked monthly returns was approx. +24% (-19%), significantly higher (lower) than the average of top (bottom) returns of major commodity benchmarks, including WTI and Brent crude oil.
Drivers of volatility: geopolitics, seasonality, and speculative positioning
There are several important factor behind the high volatility observed in US natural gas and crude oil, besides the well knows geopolitical risks underpinning energy markets.
First, energy commodities remain subject to seasonality, so that in the winter the increased demand would drive price expectations higher, while in the summer when demand ebbs, price expectations tend to be subdued. In this regard, inventory build-up and depletion are key macroeconomic indicators used by traders in assessing the seasonal effects of supply and demand conditions. Extreme weather can amplify the volatility of oil and natural gas. This because it directly impacts inventory levels around which near term price expectations by investors are formed and, to the extent that extreme weather can delay and backload economic activity (affecting housing construction, transportation, industrial orders, etc.), such disruptions on real supply and demand conditions can ‘dislocate’ prices on futures contracts. For instance, when severe cold weather hit large parts of US in 2014, natural gas March futures towards the end of February and nearing expiry began trading at a marked premium to April futures. This when the cost of carry and normal seasonal weather patterns would otherwise compel investors looking to roll their futures contracts to price maturing March contracts at a discount to April contracts. Towards the end of February, the adjustment of natural gas March futures to spot prices was therefore sharp.
Second, the increase in speculative positions (i.e. positions held in option and futures contracts that are for non-commercial purposes) of traders, hedge funds and brokers’ proprietary desks on NYMEX and ICE (the major commodity exchanges where crude oil and natural gas are traded) is likely to have added to volatility. For instance, crude oil has seen a significant build-up of speculative bullish bets on NYMEX in recent years. Currently, some 328K of net long speculative positions on WTI crude oil comprise approx. 13% of total open interest. These levels are much higher than even during crude oil’s episode of boom and bust in 2008. Given that in the beginning of July 2014 net long speculative positions stood at ~460K contracts (approx. 20% of open interest), the sharp unwinding of 123K of such positions that is likely to have contributed to WTI crude oil’s fall still leaves the total number of bullish bets on the commodity at elevated levels. It may portend more unwinding and potentially considerable more volatility for crude oil near term, especially when choppy sideways markets force speculators to close their bullish bets. Natural gas is at times also prone to relative large speculative trading. In the first half of 2014, net long non-commercial positions comprised approx. 17% of total open interest on average, with speculators holding over 1 million of such positions on US natural gas in the winter period of January and February.
As oil and gas futures zigzag amidst an uncertain outlook, investors looking to leverage their exposure to oil and natural gas using ETPs should consider switching between both bullish and bearish positions over shorter investment horizons. This strategy is in contrast to a bearish position maintained during the directional fall seen in oil and gas last summer, where short ETPs tracking crude oil and natural gas delivered better than expected returns. For instance, the leveraged returns of Boost WTI Oil 3x Short Daily ETP (3OIS) and Boost Natural Gas 3x Short Daily ETP (3NGS) in the month of December were 73% and 134%, respectively. Compared to the performance of crude oil and natural gas futures of 20% and 30%, respectively, in the same period, the directional downtrend helped exceed the expected performance by more than the leverage factor of 3x. This month (to 13 Feb 2015), crude oil and natural gas futures are up 9.4% and 4.2%, respectively, while Boost WTI Oil 3x Leverage Daily ETP (3OIL) and Boost Natural Gas 3x Leverage Daily ETP (3NGL) are up 22% and 10.6%, respectively.
Investors sharing this sentiment may consider the following short and leveraged ETPs:
- Boost Natural Gas 3x Leverage Daily ETP (3NGL)
- Boost Natural Gas 3x Short Daily ETP (3NGS)
- Boost Natural Gas 2x Leverage Daily ETP (2NGL)
- Boost Natural Gas 2x Short Daily ETP (2NGS)
- Boost WTI Oil 3x Leverage Daily ETP (3OIL)
- Boost WTI Oil 3x Short Daily ETP (3OIS)