
ETF Flows 2018: Bond and Stock stench is making this the year of Commodities

Figure 1: Asset Class Rotation
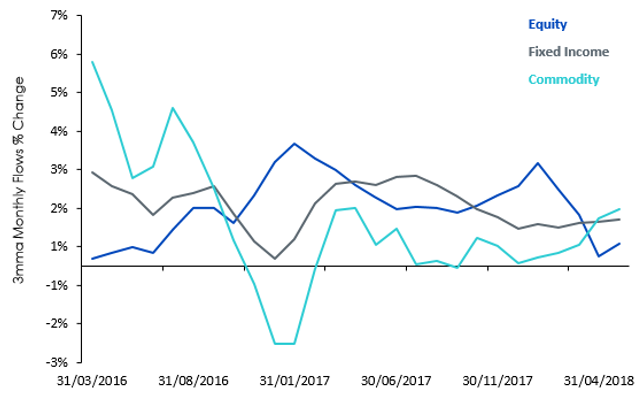
Source: Bloomberg, WisdomTree, data available as of close 31 May 2018.
Past performance is not indicative of future results. You cannot invest directly in an Index.
The return of volatility in 2018 underpinned by geopolitical risks has led to a remarkable turnaround in the trend of Exchange Traded Product (ETP) flows in the first half (H1) of 2018. While historical flows cannot be relied on as a harbinger of future trends, it does serve as a gauge of investor sentiment. In H1 2018, commodity ETP flows surged the most leaving equity and fixed income ETP flows on the back burner.
Figure 2: Commodity Flows H1 2018

Source: Bloomberg, WisdomTree, data available as of close 31 May 2018.
Past performance is not indicative of future results. You cannot invest directly in an Index.
Commodity bull tilt is broad-based this time
Broad commodity basket ETPs garnered the highest inflows surging 19% in H1 2018. Historically strong inflows into gold ETPs would act as a precursor to inflows into broad commodities, especially during times of uncertainty. However, this year we have witnessed a broad-based recovery across commodities within energy, industrial metals and agriculture. Crude oil (+12%); Wheat (+24%), Cotton (+16%), Nickel (+23%) (as of 6 June 2018) helped drive inflows into diversified commodity basket ETPs.
The added benefit of diversification has helped align investor interests in favour of higher exposure to longer dated commodity baskets as inflation gathers steam. Precious metal ETP flows, dominated by gold ETPs attracted the second highest inflows as investors sought refuge amidst the ongoing escalation of trade tariffs and political chaos in Italy. Despite being known as the first port of call in times of uncertainty, gold’s price performance in H1 has been lacklustre as the rising interest rate environment in the US has been weighing on its performance. We continue to expect gold prices to be range bound and volatile amidst the ebb and flow of tariff wars and the certainty of further rate hikes in the US.
Record warm weather helped agriculture ETPs harvest the third highest inflows. Energy ETPs suffered the most redemptions despite the strong performance staged by energy commodities. Energy ETP flows have historically displayed an inverse relationship to their prices, in contrast to most commodities. This year seems to exhibit an extension of that trend, as investors appear to be less convinced of a continuation in the oil price rally.
Quality and small caps permeate equity flows
In contrast to the US, European equity ETPs suffered the highest outflows reflecting the slowdown in economic momentum and ongoing political uncertainty. After the recent market correction, European equity valuations at 16.3 times Price to Earnings (P/E) ratio coupled with a higher dividend yield, offer a better investment case in comparison to the US at 21x P/E. Amidst the rising rate environment in the US, we expect the stronger US dollar and rising wage growth to negatively impact US earnings that appear to have peaked in Q1 2018. While accommodative monetary policy, subdued inflation and a weaker euro are likely to support the long-term growth story in Europe.
Small cap global equity inflows took the lion’s share of equity flows triggered by the rising protectionist rhetoric, as a large proportion of their business is generated domestically. While technology led ETPs drove the highest inflows up 19% across equity sectors. It was not surprising to see momentum as a style factor continue to outperform in H1 2018 since it has a high allocation to technology stocks. However, it’s worth noting that the quality style factor accumulated strong and consistent inflows throughout H1 2018 in comparison to momentum ETFs that suffered strong outflows in March and April.
Figure 3: Style tilts within equities in H1 2018

Source: Bloomberg, WisdomTree, data available as of close 06 June 2018.
Past performance is not indicative of future results. You cannot invest directly in an Index.
Rotation within fixed income favours the short end
Fixed income ETP flows in H1 2018 have lagged equities and commodities. Within fixed income ETPs, we saw a deeper rotation emerge out of corporates into treasuries. Investors sought out emerging market debt ETPs at a torrential pace as the fundamental story behind emerging markets remain supportive. Since August 2017 high yield ETPs witnessed five consecutive months of outflows, in lieu of investment grade ETPs, however the inflows have stabilised since then. The rising interest rate environment has elevated interest in the short end of the curve at the expense of the long end.
Figure 4: Rotation within fixed income H1 2018

Source: Bloomberg, WisdomTree, data available as of close 31 May 2018.
Past performance is not indicative of future results. You cannot invest directly in an Index.