

UK Gilts: Post-Brexit and post-Sterling weakness

Investors have become increasingly concerned by the outlook for UK Gilts given the complex outlook following the extraordinarily strong rally that occurred post-Brexit. In the immediate aftermath of the vote to the leave the EU, 10 year UK government bond yields declined from 1.48% (23 June) to a dramatic low of 0.61% (12 August). Sentiment was aided by the pre-emptive monetary policy moves by the Bank of England, designed to stave off a post-Brexit slump in economic activity. The cut to interest rates, from 0.5% to 0.25%, and the implementation of further expansionary monetary policy, increasing the asset purchase facility from £375bn to £435bn, all of which helped drive gilt yields to all-time lows. Since hitting this exceptional low level there has been an element of retreat as other economic forces have become apparent and recently, 10 year yields were substantially higher at 1.288%, still below pre-Brexit levels.

Gilts supported by net overseas purchases
One part of the market dynamics that probably contributed to the sharp decrease in yields was the substantial increase in net purchases of Gilts by overseas investors. Again, in contrast to widely held expectations, overseas investors significantly increased their purchases with September’s net purchases at £13.3bn being the highest monthly figure since October 2015. On a rolling twelve-month basis overseas investors had purchased close to £51bn of Gilts, a 79% increase from the most recent low reached in July 2016. UK investors, on a similar rolling twelve-month view, have also turned net investors of Gilts for the first time in six months. In September 2016, UK investor net purchases hit a record high at £36bn.

But undermined by Sterling weakness
Flows in UK Gilts by overseas investors have also coincided with a sharp decline in the value of Sterling versus both the US Dollar and the Euro. These dramatic moves in the FX market have served to undermine the returns that overseas investors have had from their investments into UK Gilts. Since Brexit, Sterling has fallen by over 15% versus the Euro and over 17% versus the US Dollar. Whilst against the Euro it remains above all-time lows that were reached at the end of 2008, against the US Dollar it has reached multi-year lows at $1.22 compared to $1.60 less than two years ago. With continued uncertainty over Brexit and the final outcome, overseas investors may well be set to reverse their purchases, especially in an environment of further Sterling weakness.

And further uncertainty caused by inflation expectations
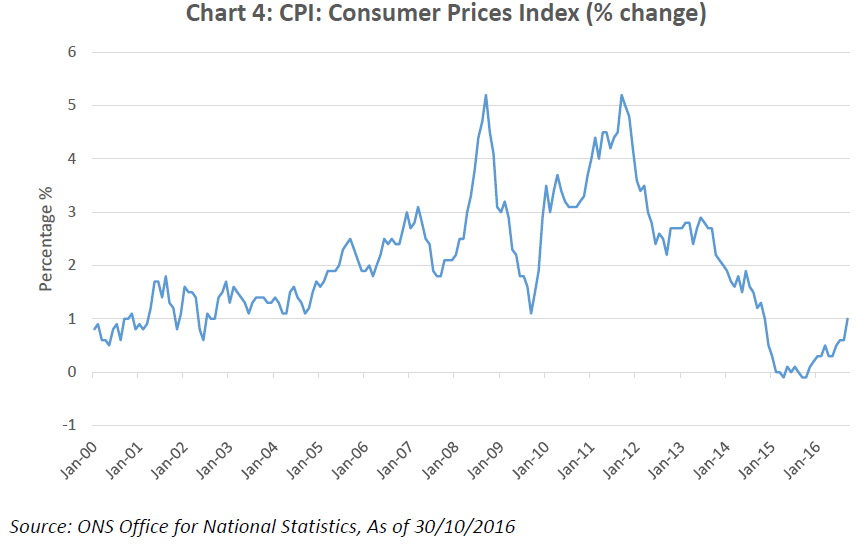
The Gilts market has been further buffeted by the impact that the weakness of Sterling is expected to have on inflation. Although the Bank of England is tasked with targeting a level for CPI of 2%, it has been below this target level since December 2013. Recently, as of September 2016, CPI was 1% but more importantly inflation expectations from both private and public sources have increased substantially. Recently, the National Institute of Economic and Social Research forecast that inflation was likely to reach close to 4% in the second half of 2017, and stay above 2% until 2020. Separately the Bank of England has raised its forecast for inflation with a peak of 2.8% expected in early 2018 and staying above 2.5% into 2019.[1]
UK Gilts and a series of risks
Overall the environment for UK Gilts has shifted substantially and is now shrouded in a mist of uncertainty and macro-economic challenges. There are potential headwinds from inflation making it difficult for interest rates to remain at current low levels. Returns for overseas investors have been impacted by the weakness of Sterling with continued uncertainty with respect to Brexit continuing to have an impact. Finally, if investors move out of relatively low yielding Gilts these flows could cause further increases in yields.
For those interested in UK Gilts:
+ Boost Gilts 10Y 3x Leverage Daily ETP (3GIL)
+ Boost Gilts 10Y 3x Short Daily ETP (3GIS)
Unless elsewhere stated the facts and figures in this blog post are taken from the Bank of England as of 30/10/2016
Sources
[1] The National Institute Economic Review No. 238 November 2016