

Behind the Markets podcast: Trevor Greetham of Royal London Asset Management on multi asset portfolio management

On 17 March 2023, we had the pleasure of speaking with Trevor Greetham, Head of Multi Asset at Royal London Asset Management.
Royal London is the largest customer-owned life insurance company in the United Kingdom. There are about 2 million pension customers. The asset management division is managing $177 billion assets, measured in US dollars, with $100-120 billion in multi asset, giving a sense that when Trevor is talking about different positioning, he is talking about a very large portfolio.
Inflation to become “spikeflation”
Almost everyone is offering different views on the global inflation picture in 2023, emphasising the contrast of a decade after the Global Financial Crisis of 2008-09 to where we are today. Trevor believes a range of macro drivers, including deglobalisation, limited fossil fuel supply as we transition to net zero, and a more uncertain geopolitical backdrop, suggest we are in a more inflation prone world verus the last four decades.
The Bank of England (BOE) shares the US Federal Reserve’s focus on getting inflation back to a range around 2% but, during 2022, inflation in the UK spiked to roughly 11.5% - an overshoot of 9.5%. The rate of inflation is likely to drop smartly but Trevor expects to see more of these episodes with inflation spiking and then falling back, a phenomenon he calls “Spike-flation”.
The three big inflation spike periods from 1900 to present day in the UK (and Trevor noted the global picture looks quite similar) are World War 1, World War 2, and then the 1970’s. Headline inflation did drop back after each of these periods, but aggregate price levels exited anything from two to four times higher than they started.
Hedging strategy for inflation
If there are to be inflation spikes, one must employ strategies with potential to hedge this impact on a given portfolio. While Trevor emphasised a multi-asset approach including commercial real estate, which can see rents rising with inflation over time, his main emphasis when it came to inflation hedging was commodities. Commodities have historically offered some of their strongest returns when the environment is characterised by the aforementioned inflation-spikes, and it’s notable that during these actual spikes it can be difficult to see strong returns from either stocks or bonds.
In fact, we see in Figure 1 that inflation-spikes have been associated with some of the worst stock and bond returns that we have seen over a very long period of time, with 2022 a case in point.
- Figure 1 displays yearly total returns of the US 10-Year Treasury and the S&P 500 Index, going back to 1928 and extending forward almost 100 years to 2022.
- The left-side scatter plot shows stock and bond returns in nominal terms. There are only four years where both the S&P 500 Index and the US 10-Year Treasury had negative returns—1931, 1941, 1969, and 2022. On the left side, notably, 2022 corresponded to the lowest point for Treasuries on the vertical axis.
- The right-side scatter plot shows the same data but in real terms, subtracting inflation from both stock and bond returns. Besides seeing more of the dots pulled below the horizontal axis, indicating a negative real return for bonds, one can also see far more dots (14 now) in the quadrant the represents a negative real return for the S&P 500 Index and for the 10-Year Treasury. Most, if not all, of these 14 years were characterised by the tendency of ‘inflation-spiking’ that Trevor was referencing in our conversation.
Figure 1: Scatter plot of returns for S&P 500 Index and US 10-Year Treasury Note

Source: Royal London Asset Management.
Historical performance is not an indication of future performance, and any investments may go down in value.
Commodity allocation strategy
We delved more deeply into the way in which Trevor believes a commodity exposure should be implemented. There was a focus on diversification, and the established benchmark of the Bloomberg Commodity Index (BCOM). The BCOM, roughly speaking, splits into three groupings, about one-third energy exposure, one-third agriculture exposure, and one-third metals exposure.
It's always an interesting discussion to contrast how different investors look at different benchmarks. Many European investors are precluded from even considering the S&P GSCI Index (GSCI), as it doesn’t meet the diversification rules specified within the UCITS1 framework. Relative to the BCOM, the GSCI is going to be much more heavily influenced by movements in energy prices. Trevor was also noting some of his views on gold and how it can be a bit more ‘currency-like’ than ‘commodity-like’ in its behaviour. For example, an environment where the US Federal Reserve is cutting rates and the US dollar weakens, would create an interesting tailwind for gold whereas industrial commodities could struggle.
US Federal Reserve policy, interest rates and cycles
Trevor related central bank actions to driving a car. There are certain inputs drivers see, including through the windows or from the gauges, like the speedometer, and most typically there are meant to be many quite small ‘course-corrections’ and not much slamming on the brake or the accelerator. Notably, he related the debacle in the UK, that was the very short Prime Minister tenure of Liz Truss, where on the one side the BOE was trying to tap the brakes to moderate inflation while the government was saying they would be cutting taxes and ramping up deficit spending, thereby slamming the accelerator. We know a car cannot be safely driven this way and in markets we saw stresses erupt within the Liability Driven Investment (LDI) strategies employed by UK pension funds.
Now, if we take one key thing about Trevor’s perspective on markets, it is a deep appreciation of history and how the current period relates to different past periods. We mentioned already that, in his view, the last forty years represents something anomalous, meaning that inflation was actually much lower than it should normally be, leading to longer business cycles. While one cannot state with certainty whether or not we head back toward something that looks like that, Trevor did remind us that, per the National Bureau of Economic Research (NBER), looking back to the 1860’s, the average business cycle length is closer to 5 years. Higher, more volatile inflation could lead us back toward shorter business cycles because the central banks will have to hike or slash interest rates more forcefully – and by the time they know that they have done enough, they have usually done too much and ‘over-corrected’ the course of the economy, leading to more ‘booms’ and ‘busts.’
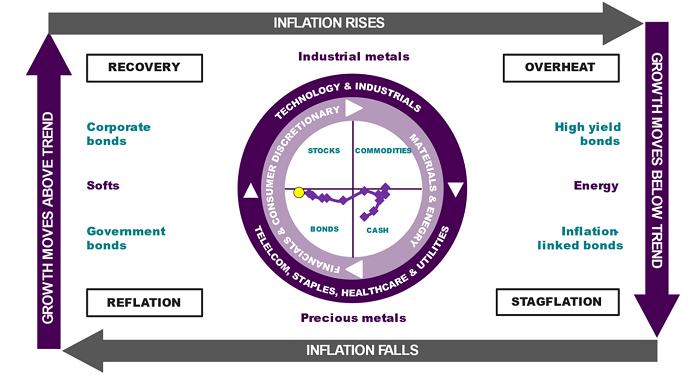
To conceptualise the cycle, Trevor noted an image of an ‘Investment Clock’, which is shown in Figure 2:
- Trevor sees four distinct phases of the global business cycle depending on the strength of economic growth and the direction of inflation, the big arrows that form the boundaries of Figure 2.
- In theory, the cycle moves around clockwise, from reflation, to recovery and then on to overheat and stagflation.
- The up-down direction on the Clock captures cyclicalitly. In a strong economy, stocks and commodities do better than bonds and cash, while technology and industrial sectors outperform defensives.
- Left-right is inflation sensitivity. Commodities and cash do better than financial assets when inflation is rising, while resource sectors tend to beat financials and consumer sectors.
- The Investment Clock is clearly densely packed with information. The trail shown on Figure 2 represents monthly readings of Trevor’s proprietary global growth and inflation indicators. We note that the yellow dot represents the latest estimate, with the fall in inflation more certain while the near term direction of the economy is less clear.
Figure 2: Investment Clock
Source: Royal London Asset Management.
Historical performance is not an indication of future performance, and any investments may go down in value.
Current environment & different regional views
Trevor also shares views on different regional equity markets. Broadly, he thinks of the UK and Europe as ‘value’ oriented regions. On the other hand, the US represents a more expensive ‘growth’ oriented region. Perhaps his most interesting comment was that China may be recovering, and if we go into a regime where the US Federal Reserve is lowering its policy rate and the US dollar is weakening, this could be a much more interesting time to consider China as well as emerging market stocks for ‘defensive’ uncorrelated positioning.
Conclusion: a masterclass on global, multi asset portfolio management
We highly recommend any investor interested in gaining perspective on different asset classes and how to think about a broad, multi-asset portfolio to listen to this discussion. It is available on all of the major podcast platforms, as well as clicking here.
Sources
1 Undertakings for Collective Investment in Transferable Securities
Related blogs
+ Commodity Outlook: Cyclical pressures vs structural strengths
+ Broad commodities: an often-overlooked source of diversification