

Where is there still income in fixed income?

As investors grapple with a sizeable amount of negative yielding debt outstanding and companies reduce dividends amid the crisis, investors may be looking for asset classes that offer yield relative to other areas of the fixed income universe. According to the Bloomberg Barclays Global Aggregate Negative Yielding Debt Index which tracks the amount of negative yielding debt globally, the amount of negative yielding debt rose to over $16 trillion on 10 August 2020. With Treasuries accounting for most of that negative yielding debt and corporates being a very small portion of the overall total. In this blog, we will aim to review the yield currently offered across different fixed income asset classes and provide insight into the fundamentals of some of the areas providing the highest income at present.
For investors considering different fixed income asset classes, one can note that on a yield per unit of duration basis Additional Tier 1 Contingent Convertible bonds (AT1 CoCos) and US High Yield are offering more yield per unit of duration than many other areas of the fixed income market. Please refer to figure 1 below.
Figure 1: AT1 CoCos offer attractive yield per unit of duration
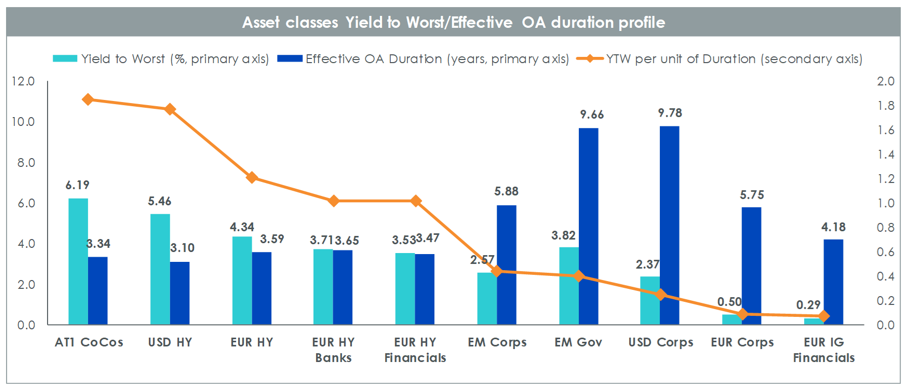
Source: WisdomTree, Markit. Data as of 30 July 2020. Yield is yield to worst (YTW) and is based on the duration-adjusted market value weighting. Effective OA duration is effective option-adjusted duration. AT1 CoCos is the iBoxx Contingent Convertible Liquid Developed Europe AT1 Index, USD HY is the iBoxx USD Liquid High Yield Index, EUR HY is the iBoxx EUR Liquid High Yield Index, USD Corps is the iBoxx USD Liquid Investment Grade Index, EUR Corps is the iBoxx Euro Liquid Corporates Index, EUR IG Financials is the iBoxx EUR Liquid Financials Index, EUR HY Financials is the iBoxx EUR Liquid High Yield Financials Index, EUR HY Banks is the iBoxx EUR High Yield Banks Index, EM Corps is the iBoxx USD Liquid Asia ex-Japan Corporates Large Cap Investment Grade Index, EM Gov is the iBoxx USD Liquid Emerging Markets Sovereigns Index.
You cannot invest directly in an index. Historical performance is not an indication of future performance and any investments may go down in value.

Source: WisdomTree, Bloomberg. Data as of 30 July 2020. Issuer rating is set to the lowest given by either Moody’s, S&P or Fitch. S&P rating is represented by the long-term local currency issuer rating. Fitch rating is represented by the long-term issuer default rating. For HY issuers Moody’s rating is represented by the long term rating based on Moody’s algorithm that considers rating class, currency and rating date to choose which actual rating qualifies as the long term rating. For AT1 CoCos issuers Moody’s rating is represented by the entity’s ability to honour senior unsecured financial obligations and contracts. HY is represented by the Bloomberg Barclays US Corporate High Yield Total Return Index. AT1 CoCos are represented by the iBoxx Contingent Convertible Liquid Developed Europe AT1 Index. The average issuer rating calculation does not take into account the portion of issuers with either NR (not rated) data or N/A (not available) data. In the calculation of the average issuer rating the weight of the constituents with either NR or N/A data is distributed proportionately among the index constituents with available data.
You cannot invest directly in an index. Historical performance is not an indication of future performance and any investments may go down in value.
If one digs further into the credit rating of the AT1 CoCo bonds and compares it to the credit ratings of US high yield bonds, one can note that AT1 CoCo bonds generally have a higher credit rating as noted in figure 3.
Figure 3: The bond ratings of AT1 CoCos are generally higher than HY

Source: WisdomTree, Bloomberg. Data as of 30 July 2020. Issue rating is set to the middle of Moody’s, Fitch and S&P; when rating is available from only two agencies, the lower is used; if only one agency rates a given bond, the rating of that agency is used. HY is represented by the Bloomberg Barclays US Corporate High Yield Total Return Index. AT1 CoCos are represented by the iBoxx Contingent Convertible Liquid Developed Europe AT1 Index. The average issue rating calculation does not take into account the portion of bonds with either NR (not rated) data or N/A (not available) data. In the calculation of the average issue rating the weight of the constituents with either NR or N/A data is distributed proportionately among the index constituents with available data.
You cannot invest directly in an index. Historical performance is not an indication of future performance and any investments may go down in value.
As the economic fall out of the global lockdown measures continue to impact the fundamentals of companies and banks, some credit positives for the European banking sector include that the rating of banks tend to be higher on average than those of high yield companies partially due to the nature of their business which typically is less sensitive to a deterioration in their operating environment and that banks benefit from potential access to central bank funding. These may be some factors that investors may want to consider as they build diversified portfolios that aim to achieve a higher income profile.