
The factors that drive performance

This blog is the third instalment of our new educational blog series on investment strategies and asset classes. Today we address the main factors associated with the potential for outperformance.
One of the most common investment themes today is that of factors. But, what are factors? Simply put, factors—sometimes referred to as risk premia—represent certain equity attributes that may be associated with higher returns above and beyond the expected risk undertaken to attain them. For example, you may likely be aware that over the long term, value tends to outperform growth1 and small companies tend to outperform large ones2. These are examples of the “value” and “size” factors. However, these are not the only factors that can drive performance.
How many factors are there?
Currently, there are five widely accepted “factors” associated with the potential for outperformance. Are these the only five factors? If one looks across databases of published academic work, it is possible to find papers supporting more than 300 different factors3, but the important point is that most do not catch onto the mainstream—people must consider costs of trading and implementation, for example. The five factors are:
- Value
- Size
- Quality
- Momentum
- Low Volatility
Defining the factors
Now, it is critical not only to know that there are factors, but to also have at least an initial understanding of why they have developed. Here, we take a closer look at these factors.
Value
Many would associate the concept of purchasing stocks below their intrinsic value with Benjamin Graham, a Professor at Columbia University who taught Warren Buffett, among others4. Over time, the market eventually recognizes these mispriced stocks and begins to appreciate them, driving market-beating returns. Similarly, the market also eventually recognizes that expectations were too positive on the more growth-oriented stocks, and when those expectations are disappointed, it drives market-lagging returns. To distil down to a single mantra: “Buy low, sell high.”
Size
This factor tends to be among the more hotly debated. The concern is that smaller companies solely introduce more risk, so while returns may be higher, it becomes tougher to characterize a premium due to the level of increased risk. Generally, however, the intuition of selecting known, successful companies as small cap investments and watching them grow is attractive (if also quite difficult to do in practice). The picture becomes clearer (and we think more interesting) when small cap stocks are combined with an additional factor focus, like quality5 or value6.
Quality
Warren Buffett, the Chairman of Berkshire Hathaway, has demonstrated an incredible track record that has, for the most part, come from buying businesses. In some of his annual letters, Buffett clearly states some of his most important acquisition criteria, which would include7: 1) Demonstration of consistent earning power and 2) Earning good return on equity while employing little or no debt. The core concept here being emphasized is quality. In a paper written in 2004, GMO wrote of quality firms8: “…even though many of these corporations tend to generate high profits year after year, they are systematically under-priced because they lack volatility.”
Momentum
Many view momentum strategies through the lens of trend-following. Assets going up in price have a good probability to continue to go up in price. This is underpinned by non-risk-based concepts such as investors tending to underreact to corporate earnings and dividend announcements or that investors exhibit delayed overreaction as they chase returns, continuing to push share prices higher and causing an even greater short-term momentum effect9. While the precise causes can be debated, we might have all heard the expression “the trend is your friend” in investing.
Low volatility
This is an interesting premium to consider, because the commonly held belief would be that higher risk demands higher potential compensation (or return) to take it10. If investors didn’t believe in this potential, why would they take higher risk? The logical implication is that lower risk stocks should therefore deliver lower returns. The data suggests otherwise, and we think this really speaks to the importance of “losing less” during the downdrafts. Many investors may not be able to stick with such strategies because, in upward trending markets, consistently watching a strategy “gain less” might not be very attractive.
Below, we indicate returns of equities associated with these factors over a very long timeframe.
Figure 1: Following the factors over the long-run
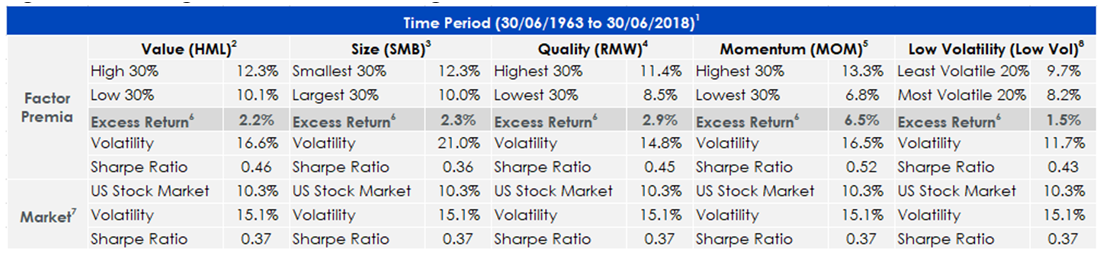
Source: Kenneth R. French Data Library.
Historical performance is not an indication of future performance and any investments may go down in value.
In the excess return category, the high 30% and low 30% is referring to the top 30% and bottom 30% respectively of a portfolio of stocks as a function of how well those stocks exhibit the qualities of their respective factor category. In the case of low volatility, top and bottom 20% are being used due to data availability. By finding the difference between the top and bottom 30%, shown as excess return in the table, the premia of concentrating on a certain factors’ qualities can be observed.
- Time period: Selected due to the data availability of the Quality factor on Kenneth R. French Data Library.
- Value (HML): Measured as the ratio of book value of equity to market value of equity of a firm, with higher values indicating a lower market price relative to this fundamental factor. Portfolio shown here is a large-cap portfolio.
- Size (SMB): Measured as the market value of equity, with smaller values indicating smaller market capitalization companies and larger values indicating larger market capitalization companies.
- Profitability (RMW), often referred to as Quality: Measures aspects of operating profitability. Portfolio shown here is a large-cap portfolio.
- Momentum (MOM): Means of measuring resilience of positive trends in share price behaviour, with stronger resilience in exhibiting positive trends leading to higher momentum. Portfolio shown here is a large-cap portfolio.
- Excess Return: References the additional return generated by investing in securities with certain attractive fundamental factors (Value, Size, Profitability, Momentum and Low Volatility) vs portfolios investing in securities with weak exposures to those same factors. Portfolios used here are large-cap portfolios except for size.
- Market (MK-RF): Refers to a market capitalization-weighted measure of the returns of all firms captured by the Centre for Research in Security Prices and listed on the New York Stock Exchange, American Stock Exchange or NASDAQ stock exchange. Volatility & Sharpe Ratio here are calculated on the returns of this measure.
- Low Volatility (Low Vol)- References securities with low variance. Portfolio shown here is a large-cap portfolio.
Conclusion
There are many ways to gain exposure to these factors. Many of WisdomTree’s strategies, by their very nature, provide exposure to several of these factors. For example, weighting by dividends can provide access to value, quality, and—in some cases—low beta (low volatility).
In our next instalment, we’ll discuss different ways to access factors and what they may provide.
Related blogs
+ The large advantages of small companies
+ The unique advantages of dividends
Source
1 Lakonishok, et al. “Contrarian Investment, Extrapolation, and Risk.” The Journal of Finance. December 1994.
2 Banz, Rolf W. “The Relationship between Return and Market Value of Common Stocks.” Journal of Financial Economics. 1981.
3 Harvey, Campbell R. & Yan Liu. “Lucky Factors.” SSRN. 15 January 2018.
4 Buffett, Warren. “The Superinvestors of Graham-and-Doddsville.” Columbia Business School. 1984.
5 Asness et al. “Size Matters, if you Control Your Junk.” SSRN. First Draft January 2015; Current Draft June 2017.
6 Dhatt, et al. “The Value Premium for Small-Capitalization Stocks.” Financial Analysts Journal. September/October 1999.
7 Buffett, Warren. “Berkshire Hathaway Annual Shareholder Letter.” 27 February 2015.
8 “The Case for Quality—The Danger of Junk.” GMO Whitepaper. March 2004.
9 Moskowitz, Tobias. “Explanations for the Momentum Premium.” AQR Capital Management. Summer 2010.
10 Blau, Benjamin M. & Ryan J. Whitby. “Range-Based Volatility, Expected Stock Returns, and the Low Volatility Anomaly.” PLOS one. 30 November 2017.