

The historical superiority of physically-backed investments in precious metals

Gold is usually one of the largest commodities in an investor's portfolio, being used as an inflation hedge, as a safe-haven asset or as part of broad commodities exposure (like the Bloomberg Commodity Index). Because most commodities cannot be accessed directly, or because investors are used to investing in equity futures, Gold is often accessed through futures contracts. But history has shown that this is not the most efficient way to access Gold or even Silver:
- Over the last 15 years, a futures-based investment in Gold has underperformed on average by 1%1 per year a physical investment in gold.
- Over the last 15 years, a futures-based investment in Silver has underperformed on average by 1.4% per year a physical investment in silver.
- In 99%1 of 1-year holding periods and in 91%1 of 3 month periods since 2007 physical gold has outperformed a futures-based gold investment
- For physical Gold or Silver to underperform over a prolonged period of time, the futures curve would need to remain in backwardation for that period. In the last 50 years, neither the Gold nor Silver futures curves have remained in backwardation for more than 15 days in a row.
The overwhelming outperformance of Physical Gold over Gold futures
Investing physically in most commodities is difficult due to operational constraints: they tend to be voluminous, expensive to store, move and insure and can be very perishable. Most commodities investments are therefore made through futures contracts. However, this is not true for precious metals and Gold in particular. Gold is extremely durable, it carries a high price tag per weight, and therefore can be stored very cheaply in bank vaults. Overall, a physical investment in Gold is easy and cost-efficient. Investors can therefore invest in Gold
• physically, using, for example, physically-backed Exchange-traded products ("ETP")
• or through futures contracts
When investing in a physically-backed ETP, the cost of investing is known in advance. All costs are grouped in the products' total expense ratio, which can be as low as 12 bps per year. When investing in futures contracts, the cost of investing is not known in advance as it is subject to a roll yield linked to the shape of the futures curve, which can change at any time. So investors need to ask themselves how often is the cost of investing in futures contracts above 12bps and how often is it below 12bps.
In Figure 1, we compare the performance of
• physical Gold and,
• a fully-funded future based investing using the BCOM gold index as a proxy
The result is very clear. Over the last 15 years, a futures-based investment in Gold has underperformed on average by 1%1 per year a physical investment. A lot more than 12bps!
Figure 1: Historical comparison of investment in Gold physically or through futures
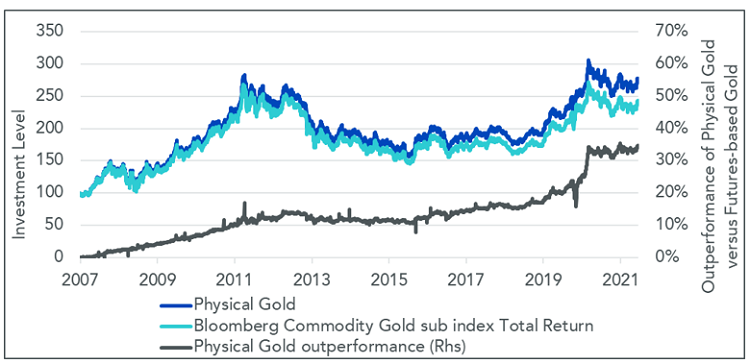
WisdomTree, Bloomberg. From 4th June 2007 to 19th November 2021. The Performance of the physical Gold was observed at 1.30 PM Eastern Time to match the BCOM sub-index calculation time.
You cannot invest in an Index. Historical performance is not an indication of future performance and any investments may go down in value.
.png?sc_lang=nl-be&hash=9F429EAA9DF8123B0B0C323C62D7D071)
Source: WisdomTree, Bloomberg. From 4th June 2007 to 19th November 2021. The Performance of the physical Gold was observed at 1.30 PM Eastern Time to match the BCOM sub-index calculation time. You cannot invest in an Index.
Historical performance is not an indication of future performance and any investments may go down in value.
More importantly, looking at one-year holding periods, physical Gold has outperformed futures-based Gold 98.99%1 of the time. Even considering the 12bps of costs of a Gold ETP, physical Gold outperformed 97.6%1 of the time. Even on short investment periods, physical Gold outperformed most of the time (90.74%1 of 3 month investment periods).
Why is physical Gold a more efficient investment
The shape of the futures curve drives the cost of investing in futures-based Gold. In contango, investors bleed money through the roll yield. For gold futures investment to outperform physical Gold in the medium term, the roll yield needs to be under 12 bps per annum. The curve needs to be in a very slight contango or in backwardation. In backwardation, the investor benefits from the roll yield (instead of paying it).
Unfortunately for investors in futures, the Gold futures curve is driven by very stable factors that lock it in contango most of the time. Looking at the long history, the average roll yield between the 1st and 3rd futures for Gold is -1.5% (i.e. the third contract was 1.5% more expensive than the 1st one). The curve was in backwardation only 63 days over the 11,788 business days between January 1975 and November 2021, i.e. only 0.53% of the time.
Considering the 12 bps cost of an investment in a physically-backed ETP, futures-based investors would be able to accommodate a slight contango of 3bps per quarter. Unfortunately, this adds only 51 days in those 50 years.
.png?sc_lang=nl-be&hash=6DA4A0D8AEEC01376757BEF30B98FDC8)
Source: WisdomTree, Bloomberg. 2nd January 1975 to 19th November 2021. Steepness is calculated as the price of the third generic future minus the price of the first generic future divided by the price of the first future.
Historical performance is not an indication of future performance, and any investments may go down in value.
When investing in gold futures, whether its a stand-alone gold investment or as part of a broad commodity investment (like in the Bloomberg commodity index), investors are hoping that the gold curve will remain in backwardation for a large portion of their investment period. But in more than 50 years of history, this has never happened for periods longer than 15 days.
What about Silver, then?
Silver futures' behaviour is very similar to gold futures. The average roll yield between the 1st and 3rd futures for Silver is -2%. The curve was in backwardation only 76 days between January 1975 and November 2021, only 13 days more than the gold curve.
Sources
1 WisdomTree, Bloomberg. From 4th June 2007 to 19th November 2021. The Performance of the physical Gold was observed at 1.30 PM Eastern Time to match the BCOM sub-index calculation time. Historical performance is not an indication of future performance and any investments may go down in value.
2 WisdomTree, Bloomberg. From 4th June 2007 to 19th November 2021. The Performance of the physical Silver was observed at 1.30 PM Eastern Time to match the BCOM sub-index calculation time. You cannot invest in an Index. Historical performance is not an indication of future performance and any investments may go down in value.
Related Blogs
+ Gold, A Precious Asset In The Investor’s Toolbox